
You might have heard about data warehouses, analysis cubes, Power BI (Business Intelligence) visuals and other reporting but are not exactly sure what they are and if your company needs them. While you might not need to have an in-depth idea of each of these report types, it’s important to understand the basics of how these reports work together to bring meaning to all your business data.
Let's shed some much-needed light on each of the components in a reporting solution to understand the importance of each:
Transactional Data Store (TDS)
This is the database that is optimized for transactions giving you fast inserts, updates & deletes of your business data. It is used by an application for day-to-day operational tasks. It might contain your sales data, Customer Relationship Management (CRM), Enterprise Resource Planning (ERP), Supply Chain Management (SCM) or another line of business application data for your company. The data is normalized which means no duplicate data is stored in the tables. This reduces data redundancy and inconsistency to achieve data integrity. This is the database that is used for running business applications.
![]()
Data Warehouse (DW)
This is the database that is optimized for reporting giving you fast reads. The data is denormalized which means there is duplicate data stored in the tables. The duplicated data makes queries for reports and BI (Business Intelligence) visuals performant. The data from the TDS (Transactional Data Store) is processed via ETL (Extract, Transform, Load) into the data warehouse. Data can also be imported from legacy systems via flat files. Data from modern APIs is fast becoming the standard for ingesting data into a data warehouse. Companies need to ensure they have a true data warehouse instead of a dumping ground for data with little modifications.
Companies need to make good decisions and to make good decisions, they require good data. The best source for the data is a properly-designed data warehouse and not a “reporting warehouse” or a “data swamp”. As you can see in the image below, the data warehouse (titled WideWorldImportersDW) is made up of tables, dimensions, facts, and integrations.
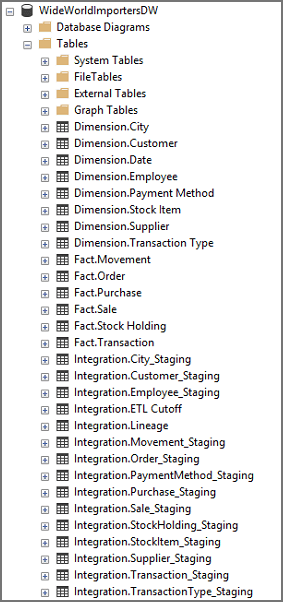
Dimensions and Facts are created from the ingested data that are used in reporting. The Fact tables contain record data that can be aggregated (often using SUM, AVG, MIN, MAX) against. A Fact table has a specific grain that defines the level of detail for the records. The Dimension tables are used to slice the facts that answer the business staff’s data questions. Integration tables are for data ingestion. The integration tables are hidden from business users as they are only used for processing.
When building a data warehouse, it’s important to lay a solid foundation for future data migrations or potential company acquisitions. A true data warehouse should be set up in a generic manner and not based around a specific system your company is using, like an ERP or CRM system. With a solid foundation in place, you can avoid any potential hiccups when making transitions.
Master Data Services (MDS)
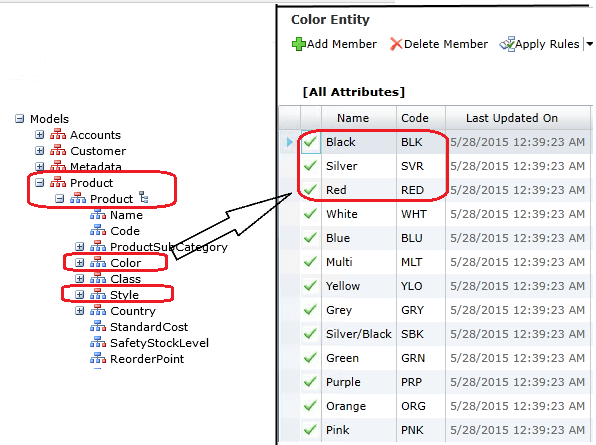
Master data represents data about business entities for business transactions. These entities can be parties like individuals, customers, suppliers & employees. Other entities are products, ledgers, or cost centers. Many companies store similar pieces of data across multiple systems or own multiple subsidiaries that categorize the same data in different ways.
The goal is to conform the entities so they can be used across many fact tables in a data warehouse. When your company has data from ERP, CRM, SCM, and Accounting systems, these systems create data silos. Conforming the entities from the disparate systems allows you to have “one version of the truth” or a “golden version” of your data.
There are a few options to map these entities like Master Data Management that is included with SQL Server Enterprise edition.
Analysis Cube (Cube)
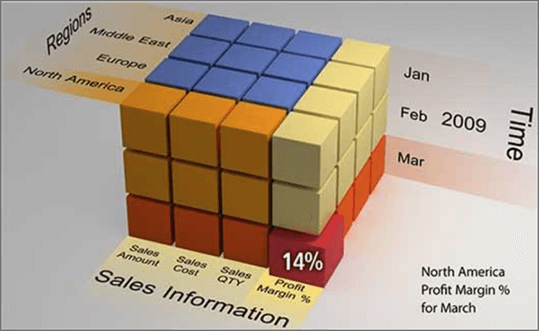
An analysis cube is used to speed up queries with larger amounts of data. A cube is a multi-dimensional dataset that contains dimensions like locations, time, and sales data. If you use a business intelligence tool like Power BI, there is an option to import the data instead of using a live query. When the data is imported, it will create a cube within Power BI. This makes cubes not always necessary for data analytics from smaller data sets.
The graphic below illustrates what makes up a typical analysis cube. As you can see, there are multiple dimensions of data (region, time, sales information) that make up each component of the cube.
Power BI Visual (Visuals)
Power BI (Business Intelligence) is one way to connect to the data warehouse or analysis cube to display insights that have been discovered in the data. Reports might have a single page with one visual or might have pages full of visuals. BI visuals give you the option to create Key Performance Indicators (KPI) to ensure your company is staying on track with its business goals.
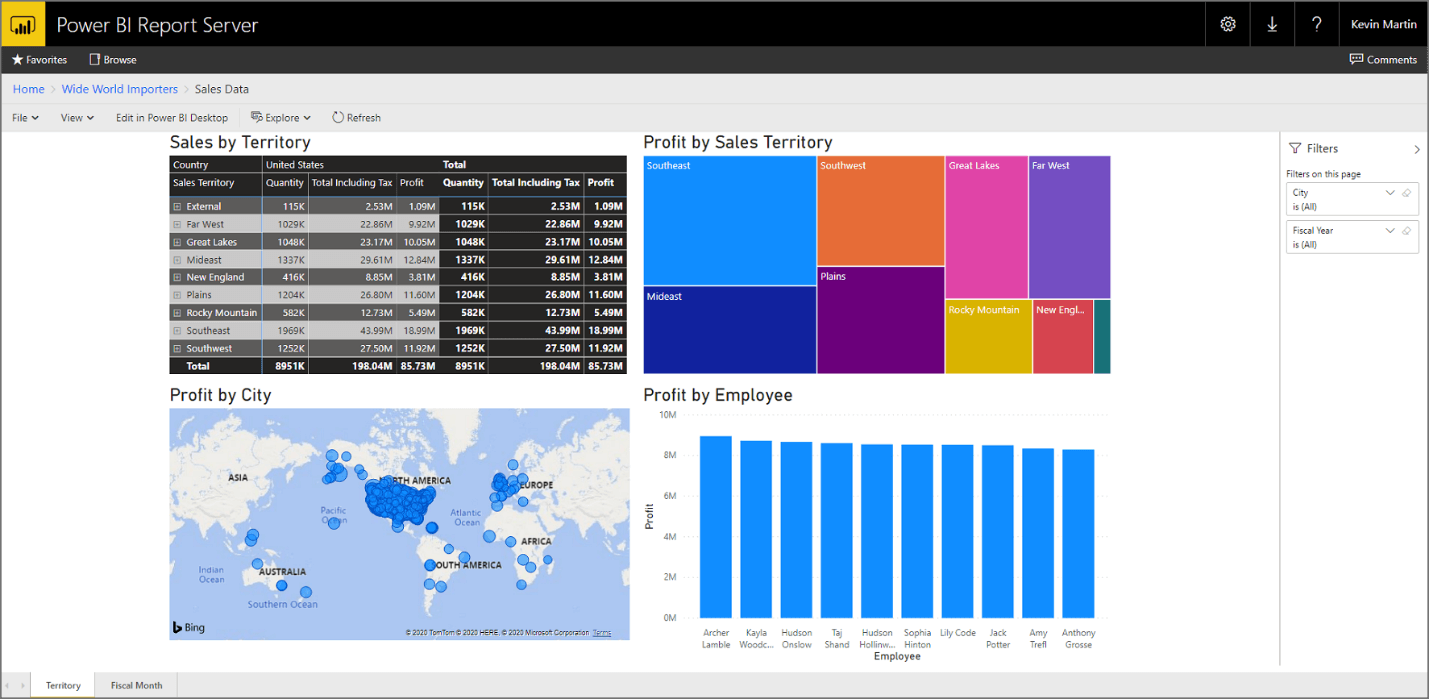
These visuals have filters and interactive clickable elements in the visual to narrow down the data records. In the visual, you can use filters, such as Midwest Sales Territory, and all the other visuals on the page are sliced by that dimension. There are other applications that can be used for business intelligence and visual creation, like Tableau and QlikView.
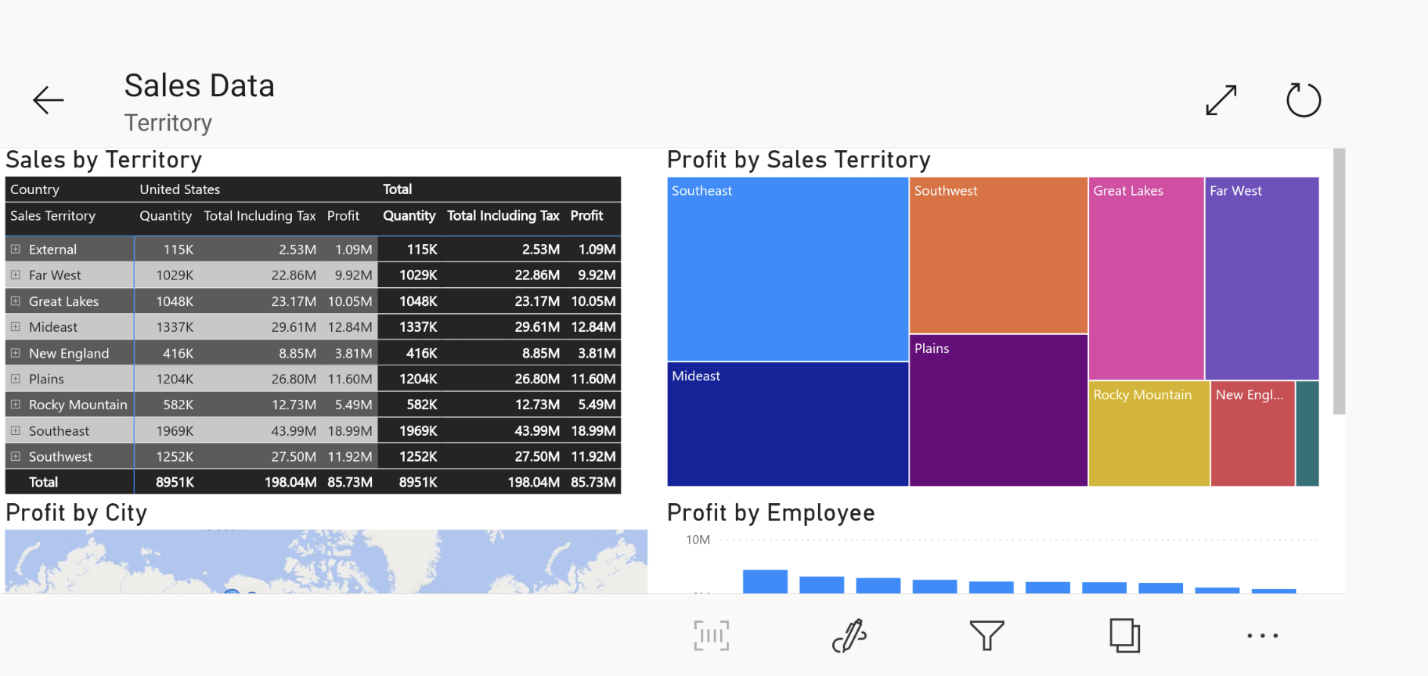
Power BI also offers a set of mobile apps for iOS, Android, and Windows 10 mobile devices. In mobile apps, you connect to and interact with your cloud and on-premises data. Business users can access their data anywhere, get notifications, annotate, and share, and dive deep into their data with powerful features for decision making on the go.
The screenshot below is displaying the same data from the Power BI Report Server on a mobile phone.
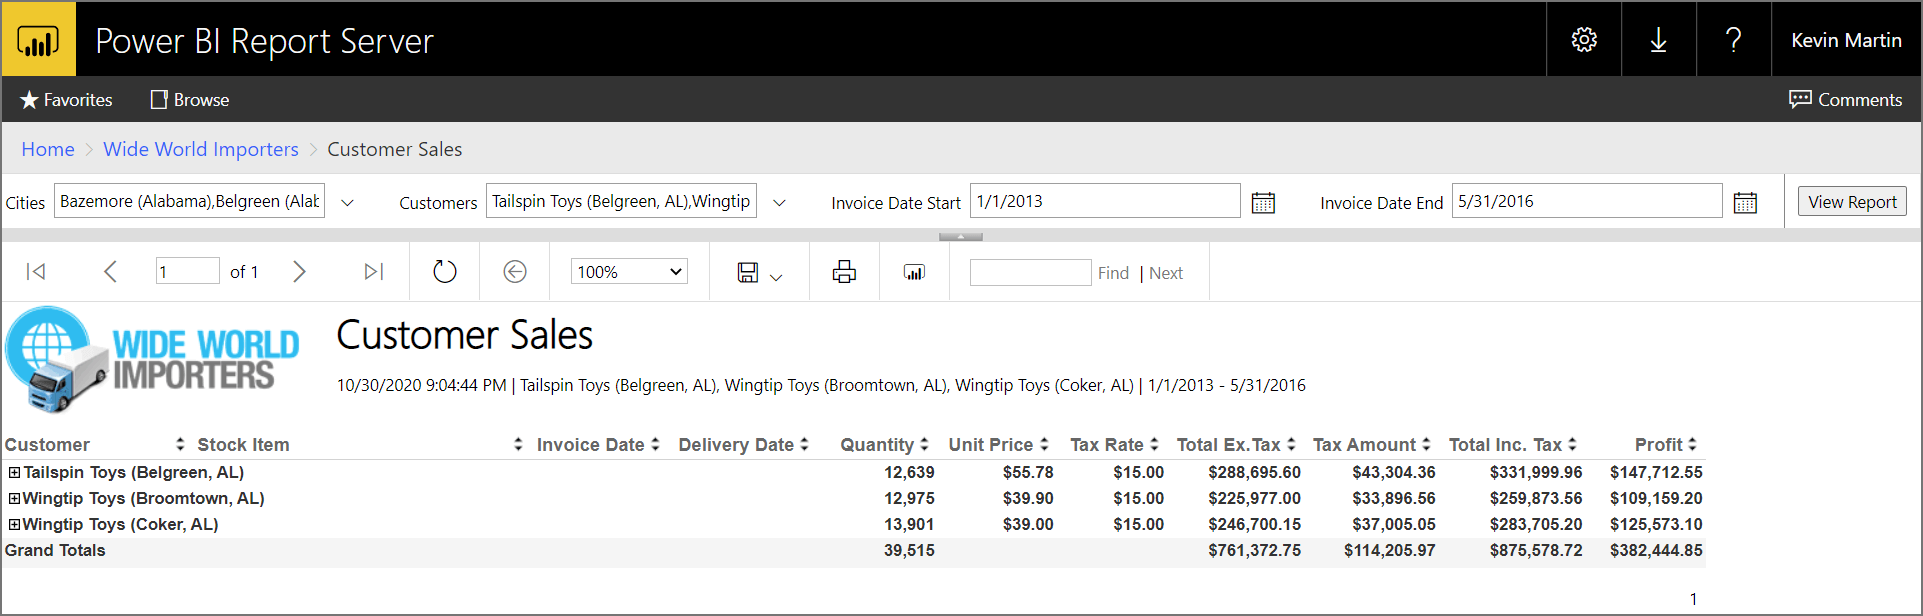
Paginated Report (Paginated)
Normally there is enough report data that does not fit on one printed page, so the lines are split up to multiple pages (pagination). Paginated reports are pixel perfect and can be used printing or formatted for complex reporting requirements, like for regulatory documentation.
These report types have parameters that are developed during report authoring that allow the viewer to narrow down the returned data.
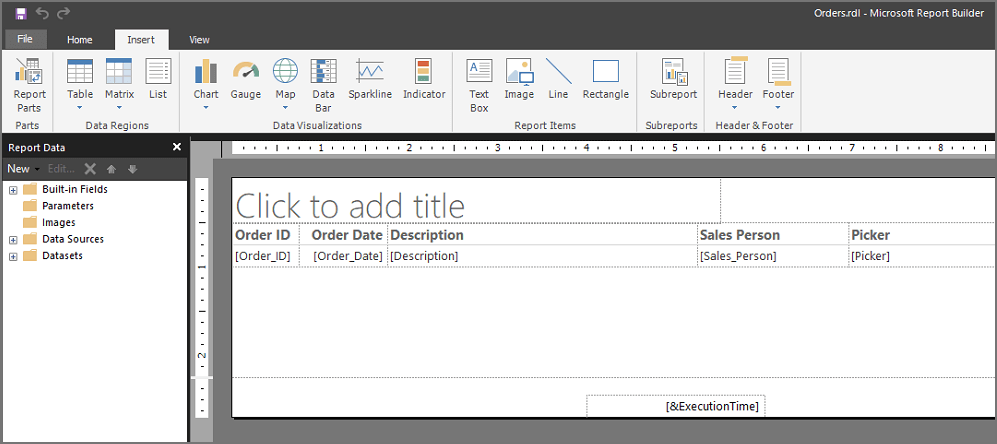
Power User Reports (Report Builder)
Report Builder is a tool for authoring paginated reports for business power users who prefer to work with a stand-alone software app instead of using a full development environment.
Business power users design a paginated report that creates a report definition. This report definition specifies what data to retrieve, where to get it, and how to display it. When they run the report, the report processor takes the report definition they have specified, retrieves the data, and combines it with the report layout to generate the report. They can preview their report in Report Builder. Then publish the report to a Reporting Services report server.
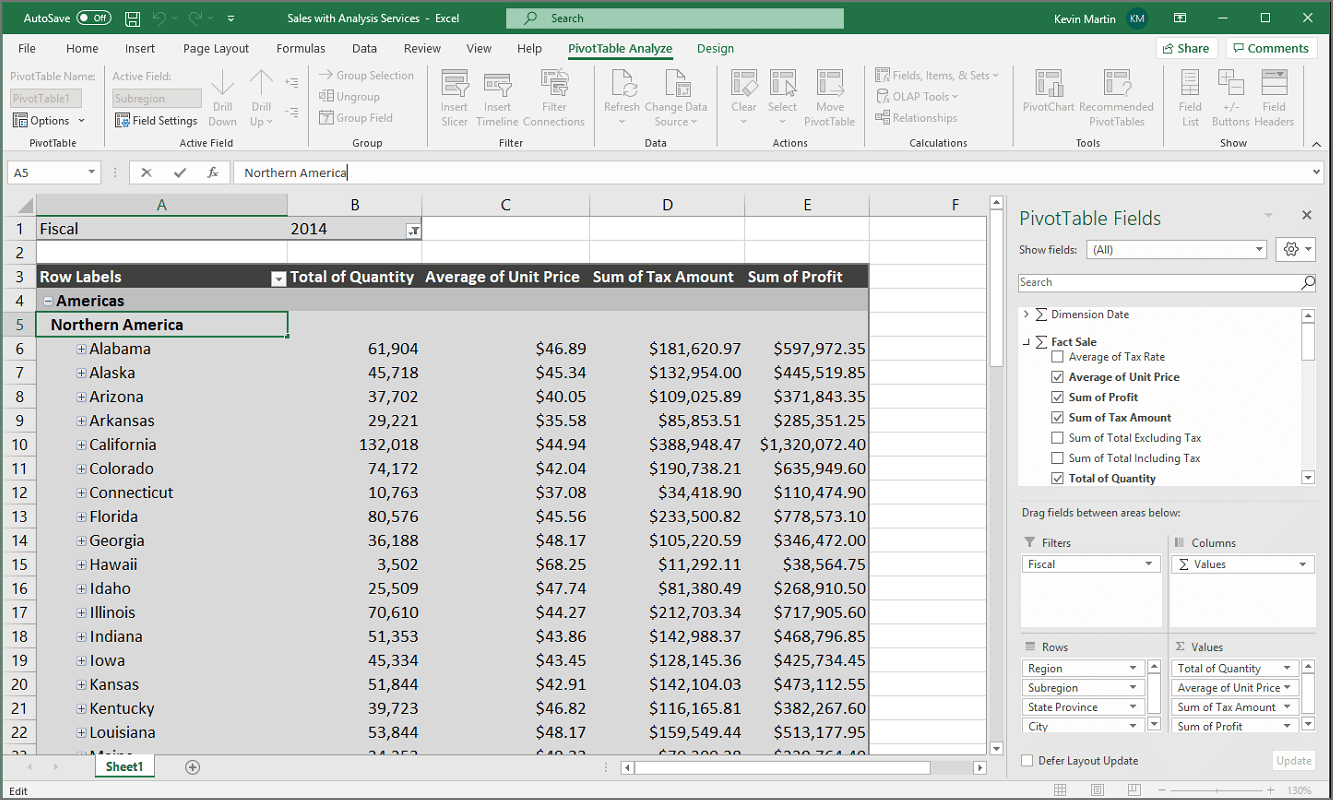
Excel PivotTable (PivotTable)
An Excel PivotTable can be used to connect to the data warehouse or analysis cube to calculate, summarize, and analyze data. The PivotTable below is connected to a cube with customized measures in the PivotTable Fields panel on the right.
As you can see, there are many components that makeup business data warehouses and report types. An Emergent Software DBA is an expert in data warehousing & ETL and business intelligence & report development and can help you determine the right fit for your business. Interested in getting started? Contact our team today!